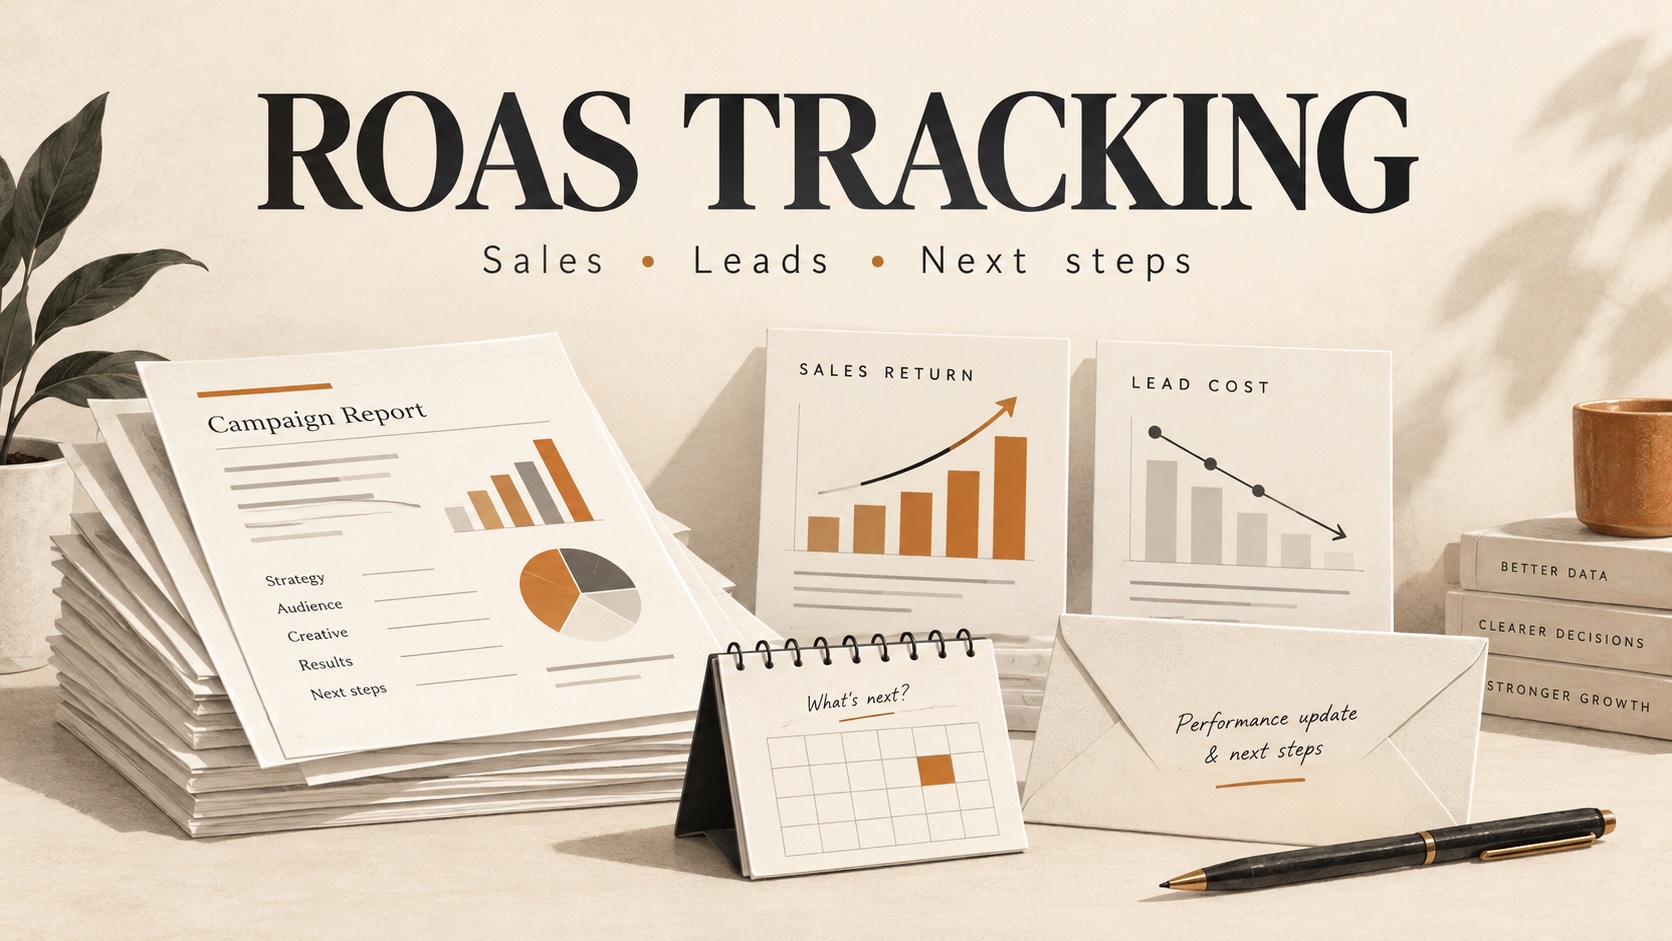
A campaign can generate more revenue while becoming less efficient. A lead campaign can deliver cheaper enquiries without creating more customers. Tracking one headline number rarely tells you what to do next.
The free SW SOFTTECH ROAS Tracker helps you keep a private performance history for each ad account, compare reporting periods, and review sales return or cost per lead. Upload a CSV report to receive an audit of the supplied figures and, when you choose email delivery, a performance email with a prioritised next-steps action plan.
This guide explains which numbers to track, how to prepare your reports, and how to turn a weekly review into a useful decision.
What is a ROAS tracker?
A ROAS tracker records advertising spend and attributed revenue across dated reporting periods. It helps you see whether your return on ad spend is improving, which campaigns are meeting your targets, and where further investigation is needed.
A ROAS calculator answers a one-off question: “What return did this spend produce?” A tracker adds history, campaign detail and comparisons. That matters when you need to review the effect of a budget change, a new offer or a different creative over several weeks.
SW SOFTTECH also supports lead-generation reporting. Choose the goal that matches your business:
| Reporting goal | Main calculation | What it helps you review |
|---|---|---|
| Sales ROAS | Attributed revenue ÷ ad spend | Sales return from the campaigns you record |
| Cost per lead (CPL) | Ad spend ÷ leads | The cost of generating your chosen lead event |
| Business-wide MER | Actual business revenue ÷ total advertising spend | Overall advertising efficiency using business totals |
Keep these views separate. Revenue claimed by several ad platforms can overlap, so adding it together does not produce reliable business revenue.
How to calculate ROAS and cost per lead
If a campaign spends 1,000 and generates 4,000 in attributed sales, its ROAS is 4×, or 400%. Each unit of ad spend generated four units of reported revenue. That is revenue, not profit: product costs, fulfilment, refunds and other expenses still matter.
For lead generation, spending 1,000 to generate 50 leads produces a CPL of 20. Use the same lead event in every report. Mixing instant-form submissions one week with qualified appointments the next makes the comparison misleading.
In Google Ads, the meaning of conversion value depends on how you configured it. Check that the value you export represents the sales or business outcome you intend to measure. Google's conversion value documentation explains how assigned values affect reporting.
For account totals, divide total revenue by total spend. Do not simply average campaign ROAS figures: a small campaign and a large campaign should not carry equal weight.
A weekly ROAS report: more sales can still mean lower return
Consider this illustrative example for the same campaign across two complete weeks. These are teaching figures, not a customer result.
| Metric | Previous week | Current week | Change |
|---|---|---|---|
| Ad spend | 1,000 | 1,200 | Up 20% |
| Attributed revenue | 4,000 | 4,200 | Up 5% |
| ROAS | 4.00× | 3.50× | Down 12.5% |
| Purchases | 40 | 42 | Up 5% |
| Cost per purchase | 25.00 | 28.57 | Up 14.3% |
Sales increased, but spend increased faster. Before increasing the budget again, review which campaigns absorbed the extra spend, whether conversion tracking changed, and whether the return still meets your business target.
The opposite pattern can happen with leads. Spend rising from 1,000 to 1,200 while leads rise from 50 to 75 reduces CPL from 20 to 16—a 20% improvement in cost efficiency. You still need CRM or sales-team evidence to judge whether those leads are qualified.
How to use the free SW SOFTTECH ROAS Tracker
1. Create a private workspace for each ad account
Open the ROAS Tracker, sign in with Google or email, and create your workspace. Set the ad account, platform, currency and reporting goal. Separate workspaces keep different accounts and currencies from being mixed together.
Your account is checked before reports are read, saved or downloaded. Other website visitors cannot browse your workspaces. Use the same account to return to your saved history on another device.
2. Prepare your campaign report
Download the workspace's CSV template and arrange your figures into its columns. You can use figures exported from Meta, Google Ads, LinkedIn, TikTok or another platform; native exports may need rearranging first.
- Dates: reporting start and end dates in YYYY-MM-DD format.
- Campaign: a consistent campaign name across periods.
- Spend: campaign spend in the workspace currency.
- Sales reporting: attributed revenue and conversions, where known.
- Lead reporting: lead count for one consistently defined event; revenue is not required.
Export spreadsheets as CSV. PDF reports, screenshots and Excel workbooks cannot be uploaded directly. Leave unknown lead or conversion counts blank rather than entering a false zero.
Use one reporting level. Adding account totals alongside the campaigns that make up those totals would double-count performance. Exact duplicate records are skipped, while conflicting or overlapping dates for the same campaign are rejected.
3. Save the upload and compare periods
Select Today, Yesterday, Last 7 Days, Last 30 Days, Last 90 Days or a Custom Date Range. The 7-, 30- and 90-day presets end yesterday, keeping the current partial day outside those views.
Comparisons use the previous equal-length period and require complete date coverage with the same campaigns. If the baseline is missing or incomplete, the tracker explains the gap instead of claiming an improvement or decline. Today can show recorded figures without an up/down verdict.
Daily views require daily records. A weekly total cannot tell you exactly what happened on Tuesday. The tracker includes a record only when its entire reporting period falls inside the chosen range; records crossing a boundary are excluded and flagged. For flexible date analysis, export daily campaign rows and use the same start and end date for each row.
Date presets follow your device date. Keep your source reporting timezone consistent and use custom dates when you need to align a specific account reporting period.
4. Review the performance email and next steps
When you save a new CSV report with the email option selected, the tracker attempts to send a performance email to your verified sign-in address. The email includes a prioritised next-steps action plan to help improve your campaigns, alongside:
- Campaign results and the main sales or lead-cost metrics.
- Positive and negative metric changes where a comparable baseline exists.
- Audit findings, target gaps and missing evidence to investigate.
- Your imported figures attached as a CSV.
The audit uses the same rules-based analysis behind our Campaign Auditor. It reviews supplied figures; it does not inspect your live ads, audiences, landing pages or lead quality, and it makes no campaign changes.
The report remains available in your private history. Untick email delivery if you want to keep the review there only. Check delivery status in the workspace: provider acceptance does not guarantee inbox delivery, and delivery limits can apply.
Manual entries also support active tracking, but the uploaded-report snapshot, audit and email workflow runs when you save a new CSV upload.
Make your campaign comparisons more reliable
Consistent inputs matter more than a colourful chart. Before treating a movement as a reason to change your campaigns, check these five things:
- Compare complete periods. Use equal lengths and the same campaign scope. Missing dates are not evidence of zero spend or zero results.
- Keep attribution consistent. Use the same conversion definitions and attribution settings across exports. Google explains that a conversion window determines how long after an ad interaction a conversion can be recorded. Changing that window can change what your reports include.
- Allow for delayed results. Recent figures may change as conversions are reported. Reconcile important decisions with your source platform's latest figures.
- Read efficiency and volume together. Lower CPL with fewer qualified leads may not be an improvement for the business. Higher ROAS at much lower sales volume also needs context.
- Review one clear hypothesis. Record the suspected issue, the change you plan to test, and the metric you will review next. A reported change alone does not prove its cause.
If the numbers themselves look unreliable, investigate measurement before optimising budgets. Our conversion tracking audit and repair service can help assess that foundation.
A practical weekly review checklist
- Export complete campaign data using the same currency, timezone and attribution settings.
- Upload the report to the correct ad-account workspace.
- Check spend, revenue or lead volume before interpreting the headline ratio.
- Review the comparison and any missing-data warnings.
- Read the performance email's audit and prioritised action plan.
- Choose one or two changes to investigate, then record what you actually changed.
- Revisit results after a suitable reporting period instead of reacting to every daily fluctuation.
For help translating the review into a broader channel strategy, use our Marketing Plan Builder. Keep the original platform report available so you can verify any figure before acting.
Frequently asked questions
Is the ROAS Tracker free?
Yes. The tracker is currently free to use. An account is required for private workspaces and saved history. Storage and email limits apply; the tracker page lists the current allowances. If an email limit is reached, the audit remains available in your workspace.
Does it connect directly to Meta Ads?
Not yet. Meta automation is marked coming soon. The current tool uses CSV uploads or manual entries and does not automatically fetch advertising data.
Will I receive an email every week automatically?
Email analysis is triggered by saving a new CSV report with email delivery selected. There is no scheduled weekly performance email without a new upload. Use your verified account email and check the report's delivery status.
What is a good ROAS?
There is no single target that suits every business. Your target depends on costs, margins, refunds and the outcome you are measuring. Use a target based on your own economics, then review both return and sales volume. A high revenue-to-spend ratio does not by itself establish profitability.
Can a service business track leads instead of sales?
Yes. Choose the lead-cost goal and supply spend and lead counts. Track lead quality and completed sales separately in your CRM; the tracker cannot infer those outcomes from a lead total.
Can I see accurate results for yesterday from a weekly total?
No. Upload daily rows to analyse individual days. A single weekly aggregate cannot be divided into accurate daily results. The tracker reports the data you provide and flags coverage limitations.
Start with your next complete report
You do not need another isolated number. You need a repeatable way to see what changed, understand what still needs checking, and decide what to investigate next.
Start using the free ROAS Tracker, create a workspace for one ad account, and upload your next complete campaign report. Keep email delivery selected to receive your performance review and prioritised next-steps action plan at your verified account address.